

Powder Keg

Traders, it is a joy to be back with you once again looking at the markets. Thank you for bearing with me as I righted the ship in my personal and professional life. The reality we all know is that trading and being active in markets cannot really be a hobby. It is a business, one of the most competitive and ruthless ones in the world, and it demands no less than your full attention and preparation. It cannot be half-assed, casually engaged, or taken lightly at any time. While this is also why it is rewarding and fulfilling, one must be honest about one’s capacity to operate in this most treacherous and shifting of seas.
Compounding this, the month of April thus far has been a rare moment in the markets, at least as long as I have been observing them, and rare moments are harder to react to. The S&P 500 future opened Monday, April 2 at 4138 and closed Friday, April 21 at 4151. I am sure all of us who are active felt there was a flurry of activity during this time, and yet the actual progress the market has made has been almost nothing. After 15 trading sessions, price has been unable to maintain a direction. What has worked is range and tactical trading, which is usually the case after a large move like the end of March.
In general, there are a few explanations for this in any market or stock in terms of supply and demand. The first is price agreement between buyers and sellers who are in relatively equal measure, keeping it steady. The second is heavy price disagreement between buyers and sellers that are still in relatively equal measure, leading to a wider and more violent range where on either extreme, one party outweighs the other as they compete for better prices for their theses of accumulation or distribution. A third is a combination of a lack of new information to change either thesis coupled with very low volatility, both of which can “shake” price enough to knock one side out of position. I think our current situation is a combination of 2 and 3, which creates a massive powder keg. The resolution of this action is likely to be nothing less than an explosion.
Why is this? After 15 days of positioning, inevitably 15 days of positions will end up offsides. Billions of dollars of positions will be in the red, probably overnight or due to an earnings reaction, and no one wants to be the last out. Furthermore, we may see a resolution to explanation number 3 with a return of volatility and catalysts, whether news or earnings. To sum this all up, this is a week or two to be ready to act, and act quickly when the time comes. The next big fluctuation is coming, and those on the right side will do very well. Let’s look for some early warnings which way.
Market Horizon: S&P
I have made a small change to my charting style in response to feedback I received about talking too interchangeably about Supply/Resistance and Support/Demand, which are related but different. Simply, as I look at it, support is a level that has already been tested and has held whereas demand is the anticipated unfilled orders from a strong price move on volume that has not yet been revisited. Both can act as areas where price may reverse or pass through. I have changed Supply and Demand to be a darker color and Support and Resistance to be lighter. Let me know if helpful.
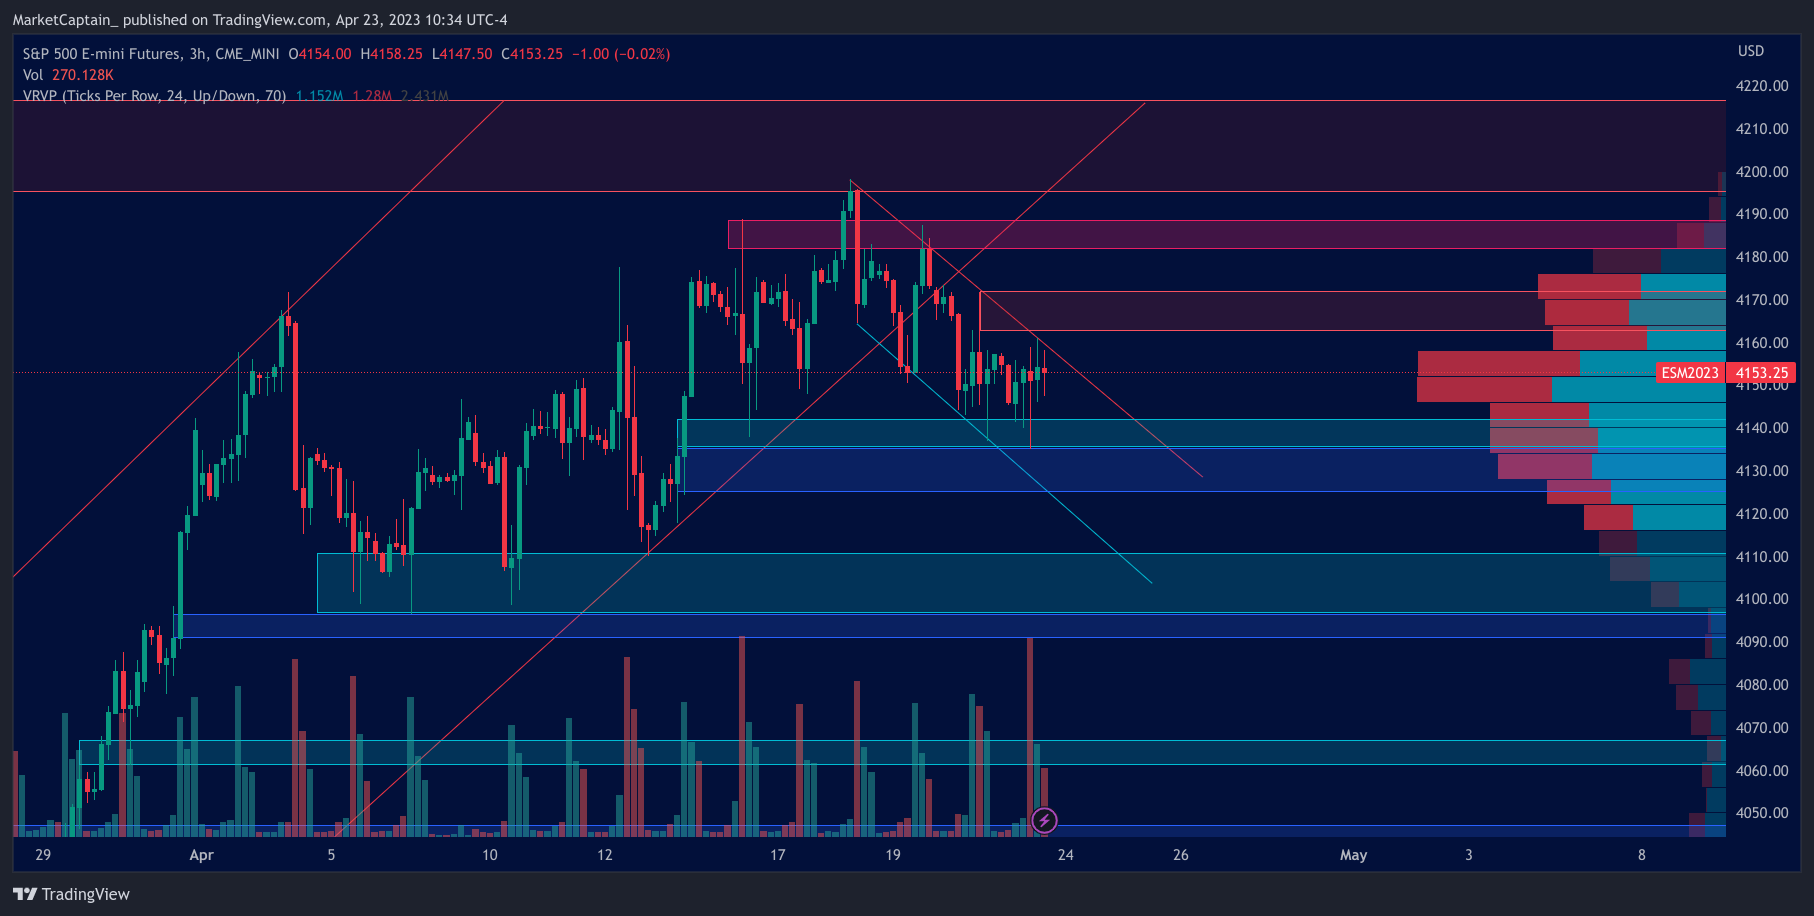
Broadly we are balancing between 4100 and 4200 as the extremes. We are now in a short term downtrend after breaking the longer term uptrend from 3800 to the downside overnight on Wednesday, resulting in a powerful sell on Thursday. We now therefore have untested supply above from 4163 to 4171. Immediately above, we have the tested resistance of 4182-4189, with one failed breakout already on Tuesday. Finally, we have remaining February resistance up to 4208 and supply from August 26th up to 4220. Only above that is there potential for a clean run to the 4250-4320 range that has been elusive the last 6 months. Tall order for the bulls without some help from earnings or the fed. 4205 to 4220 will be our Bear Battleground - must hold.
Below, we have numerous supports and demands as well, hence some of our ranging activities. 4135-4141 is next support, but now tested 3 times and thus weak. We then have Thursday Apr. 13 open demand down to 4125. A good move is then possible down to 4100, the mighty support from the beginning of the month. Similarly, directly below that we still have demand down to 4090. Below that is air. The absurd gap ups from the end of March left no consolidation and I expect a swift move to 4060 and 4030 below this. For bulls, 4090-4105 is a solid Bull Battleground and naturally coincides with our monthly range.
To Summarize:
/ES Current Position: 4150
Bear Battleground: Holding below 4220
Bull Battleground: Holding above 4090
My Lean: Mild risk off into earnings unless 4170+ trades again, lower demands and supports revisited early in the week. Larger move arrives into end of month
Plan: Watch for price to react to (either accept for preferably an hour during regular trading hours or reject) these zones, or look beyond and fail. Good moves possible from 4170 to 4200, 4220 to 4250, 4125 to 4100 and 4090 to 4060. Reversals possible within same zones to the previous - follow context.
Sector Horizon: XLE XLF XLP
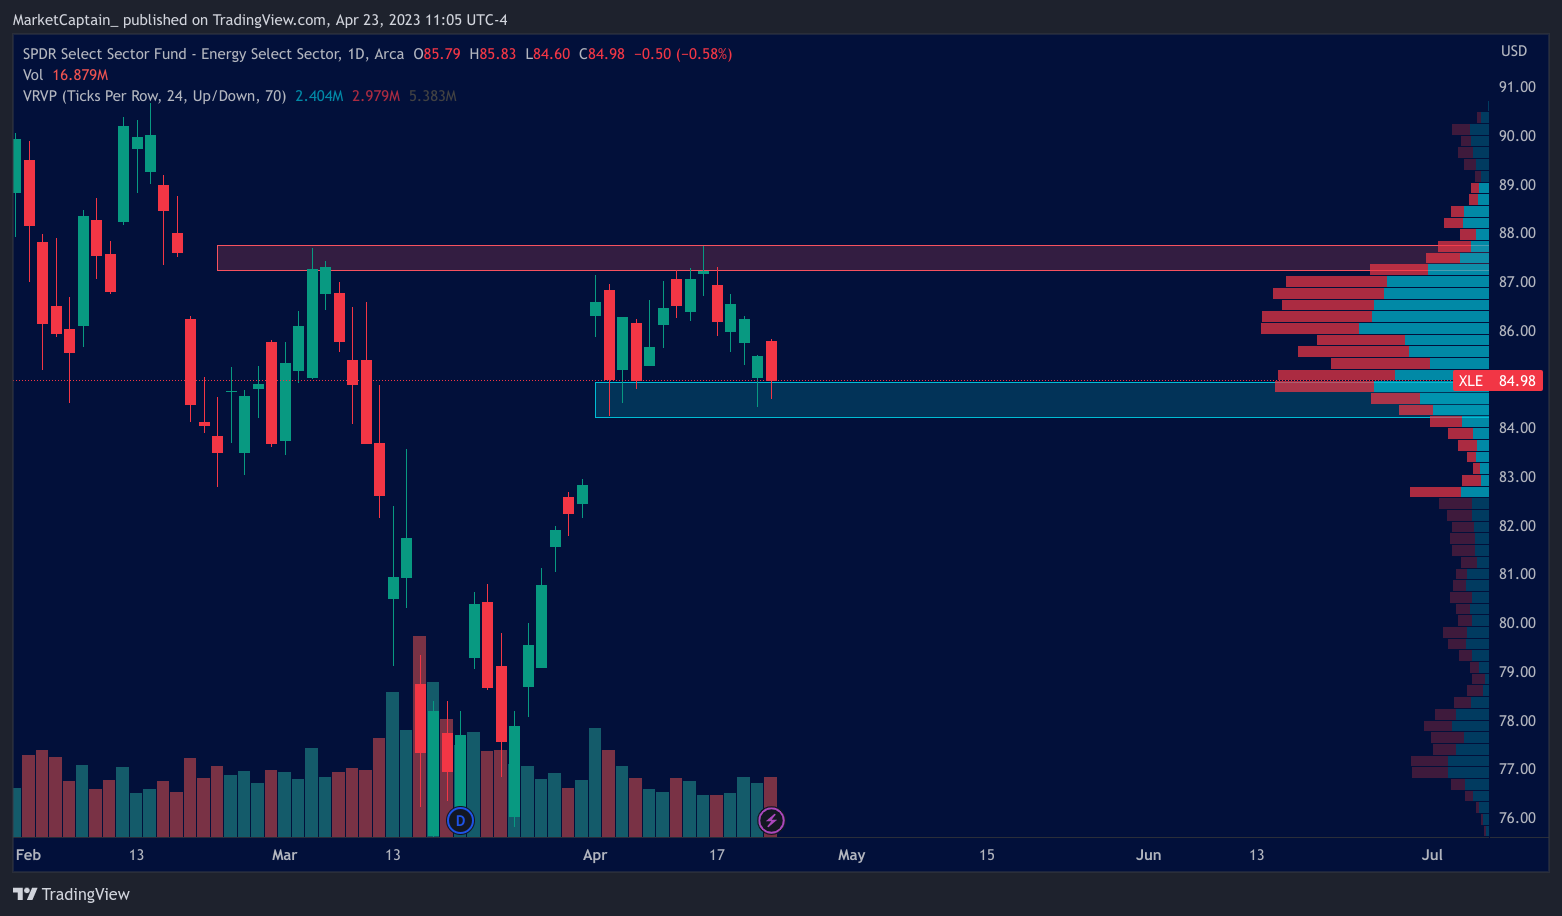
XLE: Oil has been consolidating and digested gains since the OPEC price cut and is starting to test the extremes of this range. Volume gaps below and above - observe.
Key Components: XOM CVX SLB VLO
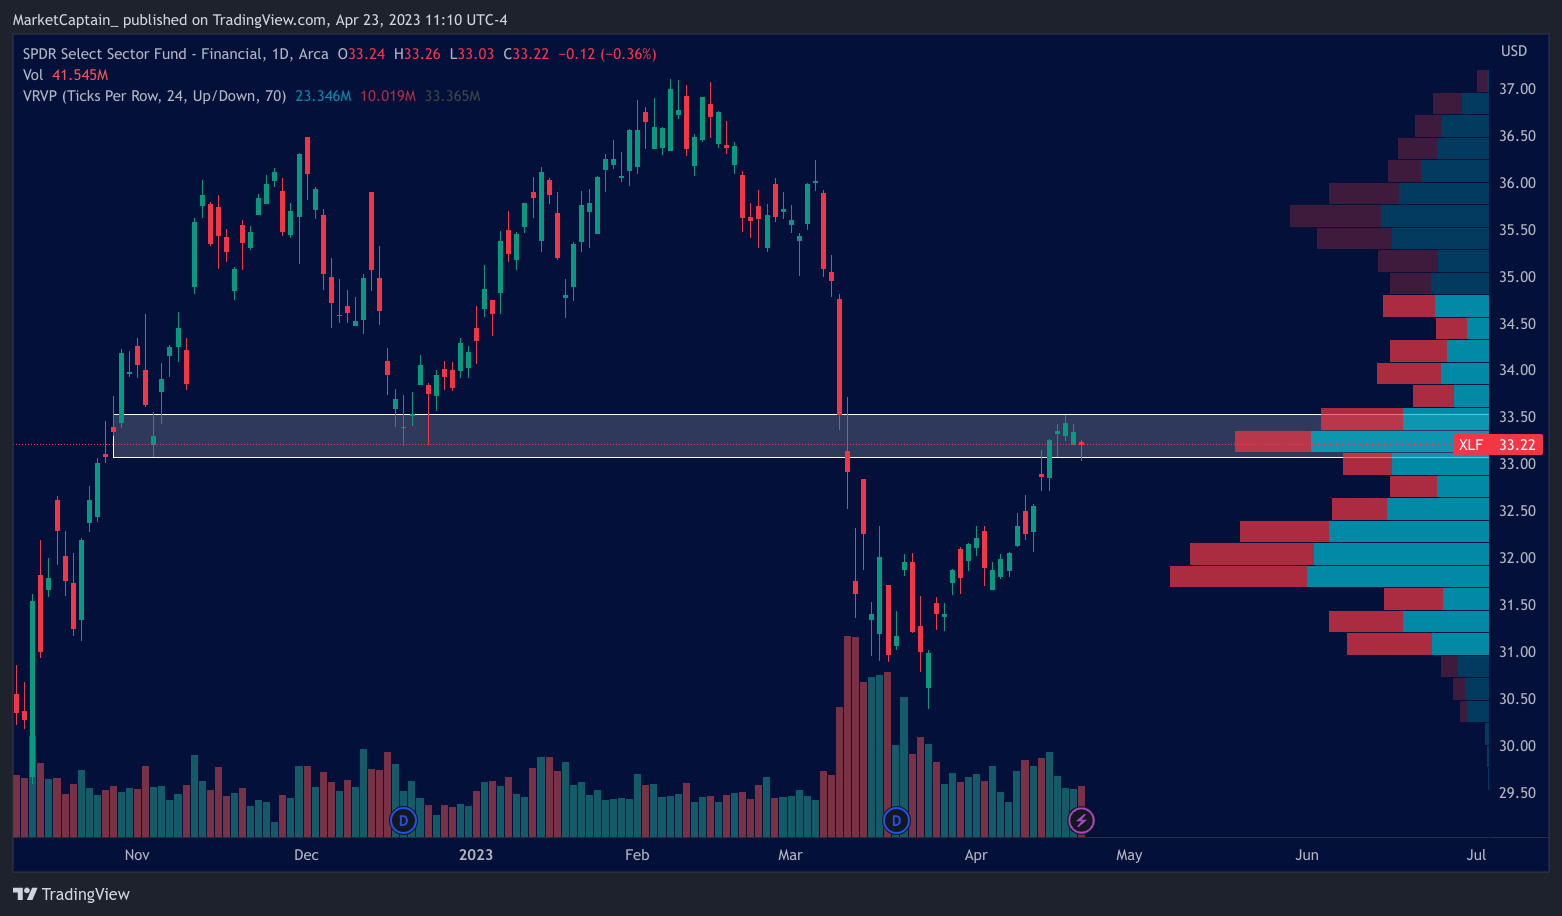
XLF: With earnings now behind and the “crisis” in the rearview, banks are now testing previous support. Either it becomes resistance or is reclaimed for longs.
Key Components: BAC WFC JPM GS MS
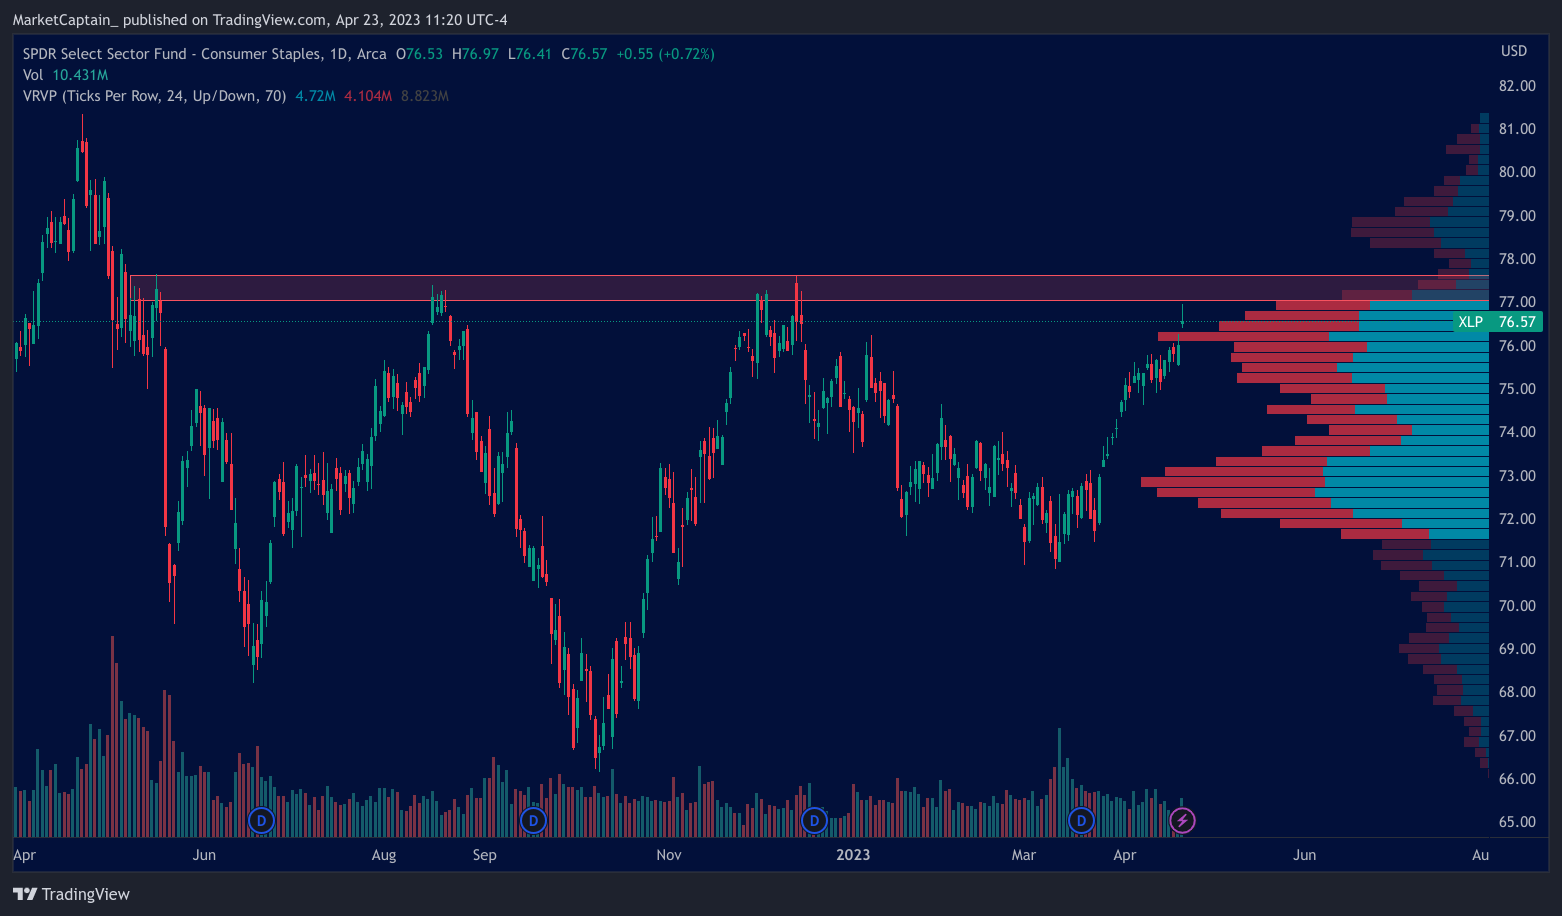
XLP: Consumer staples are coming up to a huge resistance zone as the recession trade continues to manifest. Volume pattern is an accumulation. Big spot.
Key Components: KO WMT COST PG MO PM
Macro Horizon
Obviously many movements in the last month in related markets, lots of activity in bonds, metals and crypto to comment on and not as much notable economic data. Overall, a somewhat happy picture supporting current optimism.
Bonds are broadly ranging, but the sells have been on higher volume than the buys. Not much confidence. Dollar in downtrend gold in uptrend, both helping equities. Oil and BTC failed breakouts. VIX new yearly lows, no fear or uncertainty pervading. Fed balance sheet upticked leading to QE and liquidity narrative. Inflation slowing but sticky.
The broader stock market is more likely to suffer (and thrive inverse) when:
-Bonds/TLT are weakening (currently weakening)
-TNX/Bond Yield is trending upward (currently neutral)
-Gold/metals are weakening (currently strengthening)
-Bitcoin is weakening (currently strengthening)
-Oil is strengthening (currently neutral)
-Inflation is trending upward (currently neutral)
-GDP is trending downward (currently neutral)
-The labor market and wage growth is strengthening (currently neutral)
-VIX is trending upward (currently downward)
-DXY (Dollar) is strengthening (currently weakening)
-FED Interest rates are trending upward (currently upward)
-FED balance sheet is trending downward (currently upward)
-Healthcare/Cons. Staple stocks are strengthening (currently strengthening)
Total 3 out of 13 indicators negative for equities, very light pressure
Glad to be back folks - we are coming to a major inflection point and it will pay to be prepared for either direction. Let me know your thoughts below or on Twitter!